The discovery of a partial mammoth skeleton in 1999, and its subsequent excavation in 2000, provided an opportunity to implement several innovations in the on-site mapping of the excavation and relating the excavation to real-world coordinate systems. What follows is a basic primer on what we did.
The mammoth specimen was found during the excavation of a waste-water lagoon on property owned by the City of Pratt, Kansas being leased to Pratt Feeders. While digging the lagoon the heavy equipment operator encountered a hard lens of sediment. Upon digging into it, several large bones were found. News of the discovery found its way to a reporter at the Pratt newspaper, who subsequently contacted me, then at the Sternberg Museum of Natural History. A small group from the museum traveled to Pratt for an initial investigation of the site. After an afternoon of excavating around the exposed bones it became clear that the site was more extensive and a longer excavation was needed. We planned to return to the site several weeks later.
A four-day excavation was planned with numerous volunteers and we returned to the site in November, 1999. After this exploration it again was clear that a longer period of time was needed to fully investigate the site, as we kept finding more and more fossil bone. We re-covered the site once again, and planned to return in the summer of 2000.
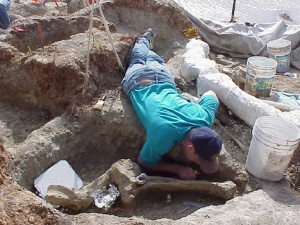
A volunteer excavates around a mammoth vertebra at the Pratt Mammoth site.
Because we had time to plan a larger excavation for the summer, and it was clear that there were many bone elements preserved, I wanted to be sure to map the site in detail, both for its paleontological resources, but also for other physical characteristics. So, I arranged to have a surveying total station on hand for the dig. We also lined up numerous volunteers, arranged a university class to be taught using the site as a learning tool, and obtained numerous donations from the generous community of Pratt. The entire community got behind the excitement of the dig, and because the site was easily accessible being at the airport, we hosted numerous visitors.
Establishment of points within the site
During the November, 1999 dig, I had established three control monuments at the site. The monuments were a hub (2 inch x 2 inch stake) and tack (a special surveying nail) driven into the ground away from the areas we were going to be disturbing in our excavations. This insured that we could re-find the control monuments and they would be used to relate all the points of the excavation to each other within the dig area.
Using the control monuments, we established an arbitrarily-oriented meter grid system. I was not concerned with the cardinal orientation of the grid so much as wanting the grid to be useful for in-site control of the dig. One of the principle uses of the grid was to demarcate 2 x 2 meter spaces to assign to volunteers to control their digging efforts. Having the grid on the ground helped to keep their efforts orderly, as they could be assigned to “dig here” and not be on top of each other. The use of the surveying total station allowed for accurate layout of the grid system across the entire site, and allowed for unlimited expansion of the system as needed.
The reason that the grid was redundant for the within-site location of bones is that all bones were located with the total station using standard radial surveying techniques. Every element removed from the site was given a field number, and the location of the element was documented in three-dimensions. Initially, the grid system was assigned assumed x and y coordinates in meters, and an assumed elevation was assigned to the control monuments so that the z dimension could be calculated relative to other points in the site.
The total station is set up over a point and aliened with another control point to get a starting line. The instrument can accurately measure distances by shooting a laser to a reflecting prism and measuring the time it takes to return to the instrument. It also accurately measures horizontal and vertical angles. With the vertical angle and the distance, it can calculate the difference in height (z) between the reflector and the instrument. So, with relatively simple calculations the x, y, and z coordinates of any point within the site can be determined. The instrument is highly accurate (within 1/1000’s of a meter in distance) so within-site accuracy is estimated to be high, likely within a centimeter or two given the reliability of using inexperienced volunteers to help with the surveying.
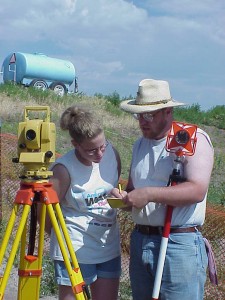
Teaching a young volunteer to use the total station surveying instrument.
Most of the elements removed from the site were located with a minimum of two points. The smallest bone fragments were located with point locations of a single measurement. If they bone had any linearity to it, it was located as two points (end and end) giving both the approximate length of the bone and its linear orientation. Several of the larger bones were located with three or more points.
All of the points located at the site are described as their three dimensional coordinates, and therefore can be plotted for visualization.
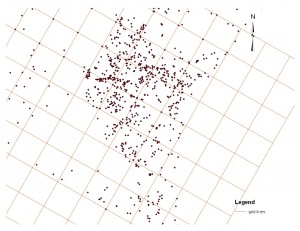
Point cloud from the Pratt Mammoth site shown in map view with the meter grid.
View the point cloud in a short animation.
Translation and rotation to real-world coordinate systems
During the excavation we used assumed coordinates and elevations. However, it is desirable to be able to locate the site, and all the points located within the site, in a real-world coordinate system so that it can be related to other localities anywhere in the world. We did not have high-precision global positioning system (GPS) equipment available, although such equipment does exist. However, using the following method we were able to get very effective results using a basic Garmin handheld GPS unit.
The accuracy of the handheld unit varies with availability of satellites, access to the open sky, variations in atmospheric conditions, basic limitations of the unit itself, and other variables. However, it is possible to locate a point on the globe to within approximately 15 feet or so. I used the GPS to record the location of two of my control monuments. I used the coordinates of the GPS reading to calculate the azimuth between the control monuments, and assumed that was the true azimuth. I knew the distance between the monuments based upon my field survey of measuring between them. I assumed the GPS reading on one of the control monuments to be true and “held” its coordinates to that reading. Using the azimuth to the other monument from the GPS reading, and the distance measured in the field, I then calculated the new coordinates for the second control monument.
With the assumption of the coordinates of the first monument, the accurate real-world azimuth, and the measured distance to the second control monument providing its coordinates, it was possible to recalculate the coordinates of every point within the dig site. It is a basic mathematic routine to translate (move points horizontally in space) and rotate (turn the points on an axis in space) all the points located at the dig site to a very close approximation of their real-world coordinates. Since we measured all the points in meters I used the Universe Transverse Mercator (UTM) coordinate system. I estimate that the accuracy of these coordinates should be within about 15 feet (the error of the reading on the handheld GPS). This is not as accurate as you could get with high-precision equipment, but it is accurate enough for almost all purposes, and can be achieved with inexpensive equipment that is readily available.
I have modified the system somewhat, but I have since used this basic system at other excavation sites with very good results. The real-world coordinates of every point from the site allows very accurate plotting of fossil sites, and even individual bone elements, in relation to other sites. It also allows for the application of geographic information systems (GIS) technology on the sites.
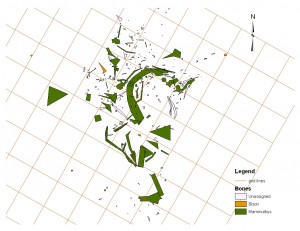
Bones drawn using the points located at the Pratt Mammoth site.
