Category Archives: Mammals

Effects of climate change on polar bears

Polar bears (Ursus maritimus) are in the news again because of dire predictions for the coming decades on their population numbers. The effects of climate change have been predicted to impact the polar regions first and most dramatically according to most models, and indeed, it is at the poles where we are recording some of the most dramatic examples of climate change. Polar bears, being the largest of the living bear species, are charismatic and popular, and because of the likely impact that climate change will have on them they have become a poster species for the climate issue.

polar bear

Polar bear, Ursus maritimus.

In a recent interview bear expert Andrew Derocher predicted that one population of polar bears (western Hudson Bay) could see its numbers drop too low to be viable within three decades (Yale Environment 360 2010). We have explored polar bears and their populations in other posts. Here I want to examine why changes in sea ice and warmer periods are such a concern for polar bears.

Polar bears evolved relatively recently, diverging from an ancestral brown bear population about 150,000 years ago (Lindqvist et al. 2010). There is a unique population of brown bears that live on Admiralty, Baranof, and Chichagof (ABC) islands of southeastern Alaska’s Alexander Archipelago. This population, called the ABC bears, is the closest brown bear relatives of the polar bears—early members of this population split off to live full time on the sea ice, evolving into the modern polar bear species. Thus, polar bears are an example of rapid mammalian evolution, undergoing morphologic changes such as elongated snouts, overall size changes, furry padded feet, and color changes, as well as social and metabolic changes to adapt to the rhythms of the arctic seasons.

It is their complex adaptations to living on the rugged ice that makes them most susceptible to changes in that habitat. They use the ice as a platform for hunting seals, as a habitat for finding mates and mating, and for traveling long distances. As the ice breaks up earlier in the spring, and re-freezes later in the winter, several weeks of prime hunting time are taken away from the polar bears. Today, they are able to spend almost three weeks less on the ice hunting than they were able to several decades ago. This is critical because after the ice breaks up for the year, the bears must fast until the next season, and longer times of open water means long fasting periods.

This can be critical for a female bear that must gestate her young, birth them, and begin to nurse them to a size large enough that they can accompany her onto the ice for hunting the next season. So, she is expending a great deal of energy in contributing to the growth of her young while fasting. If she did not build enough fat reserves the year before to withstand this metabolic marathon, she and her offspring will not survive into the following year. A few additional weeks of having to fast can be the difference between life and death.

The intimate connection that polar bears have evolved with their arctic habitat means that they are finely tuned to changes in that world. And with the effects of climate change appearing in the arctic regions first, they are in fact akin to the “canary in the coal mine,” a harbinger of things to come.

References:

Lindqvist, C., S. C. Schuster, Y. Sun, S. L. Talbot, J. Qi, A. Ratan, L. P. Tomsho, L. Kasson, E. Zeyl, J. Aars, W. Miller, Ó. Ingólfsson, L. Bachmann, and Ø. Wiig. 2010. Complete mitochondrial genome of a Pleistocene jawbone unveils the origin of polar bear. Proceeding of the National Academy of Sciences.

Yale Environment 360. 2010. For Hudson Bay polar bears, the end is already in sight. http://e360.yale.edu/content/feature.msp?id=2293.

Additional related posts:
Polar Bear Populations
Public Opinion and a Geologic Perspective on the Effects of Global Warming
IPCC

Mountain Lions

They go by many names: puma, mountain lion, mountain cat, catamount, and panther, and scientifically as Puma concolor. The mountain lion is presently North America’s second largest cat, with the jaguar (Panthera onca) being the largest.

Mountain lions are widely distributed, from the Yukon Territory in Canada south through the western states, through Mexico and to the tip of South America, giving it one of the widest distributions of any species in the New World. There is a second population center in Florida, a relic population from when the species was spread coast to coast during the Ice Age. Recently, there is evidence that they are pushing their way onto the Great Plains states from the west, with reports of sightings as far east as Kansas.

They are large predators, with males weighing approximately 140 pounds, and females 90. They are considered the largest of the small cats. What?

Cats have been divided into two subfamilies, with the big cats being tigers, lions, leopards, and jaguars. The small cat subfamily includes the smaller cats like lynx and a host of species like jungle and mountain cats, marbled cat, and ocelot. The small cats also include your house cat.

Like all cats, the mountain lion is carnivorous and eats meat exclusively. They will eat anything they can catch, from insects to large animals like deer, and very occasionally elk and moose. They also are known to kill domestic livestock including cattle, horses, and sheep. It is this that caused the cats to almost be exterminated, but with legal protection their numbers are making a comeback.

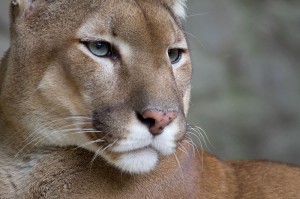
The mountain lion, Puma concolor. Photograph by Bas Lammers.

The mountain lion, Puma concolor. Photograph by Bas Lammers.

This post is another in the dangerous animals series where we are exploring animals of North America that could be considered a threat to humans. However, like all the other animals, the threat is very small. Mountain lions have been known to attack and kill people, but it is a rare occurrence. Humans are increasingly moving into remote areas that host  mountain lions, and encounters are increasingly likely, but mostly encounters involve seeing the tail-end of the cat disappearing.

Attacks are rare because unless they are threatened or cornered, attacks are brought about as the cat is hunting for prey, and since they are not habituated to seeing humans as prey, they avoid people. Many who are attacked are smaller in stature, such as children or women, and victims are often jogging or engaged in a similar activity that might trigger the pursuit instinct in the cat when they are very hungry.

Mountain lion foot print

Mountain lion foot print at a dinosaur dig in Colorado.

It is for this reason that it is recommended that if you encounter a mountain lion you should make yourself look less like prey and more like a handful. Standing up large, waving your arms, shouting, and such things will discourage the cat from attacking. Do not run.

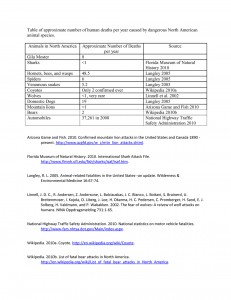
Between 1890 and 2005 there were 88 attacks on people, and 20 fatalities (Arizona Game and Fish 2010), so on average there are a few attacks, and fewer than a single death, each year. As far as risks that we live with everyday this is really is not much of a danger.

Average number of deaths per year caused by various animals

Average number of deaths per year caused by various animals

I have been fortunate to have seen a glimpse of one of these great beasts in the wild, and if you are so lucky, cherish the moment.

Arizona Game and Fish. 2010. Confirmed mountain lion attacks in the United States and Canada 1890 – present. http://www.azgfd.gov/w_c/mtn_lion_attacks.shtml.

How big was the Giant Short-faced Bear?

The character of living things on land changed forever after the Cretaceous-Tertiary extinctions, 65 million years ago. The dinosaurs on land and the marine reptiles in the oceans went extinct, leaving way for mammals and birds to evolve into those niches once held by the “terrible lizards” (dinosaurs) and other giant reptiles.

Throughout the Cenozoic, sometimes “mammal-centrically” referred to as the Age of Mammals, these warm-blooded, fur-covered creatures diversified into a wide range of beasts, including humans. While many of the land mammals got very large, they never matched the recording-holding dinosaurs for superlative size on land.

The largest animals ever known to have lived actually evolved after the dinosaurs and are in fact alive today. An ancient lineage of mammals returned to the oceans and evolved into the modern whales. (See the note about the largest animals feeding upon the smallest).

People are always excited about the Carnivores, or meat-eating mammals. There is something about the dangerous and frightening that excites our primitive nerve centers, so the carnivores are among the most popular at the zoo. (Technical note here—the word carnivore is used in two ways. Carnivore (with a capital “C”) can refer to the class of mammals, the Carnivora, most of whom, but not all, are carnivores (with a lower case “c”), meaning they eat meat. So, not all carnivores are Carnivores, and not all Carnivores are carnivores. Got it? Good.) (Also, see the series on Dangerous Animals for additional exciting facts.)

For example, I recall a visit to the Cincinnati Zoo, and while watching the famed white tigers my young daughter was thrilled when one watched her intently and kept pace with her on the ground while she ran giggling high above on the wooden walkway. She thought that it was a special treat to have one of these magnificent animals take a special interest in her. She felt less special when we mentioned to her that the tiger may not have had cuddling on its mind.

Elsewhere (see related posts below) we have discussed the Giant Short-faced bear (GSFB), Arctodus simus, the great bear from the Ice Age that lived across North America. The GSFB is the largest mammalian Carnivore known, but just how big was it?

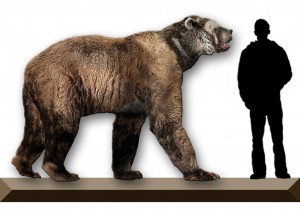
Recreation of the Giant Short-faced bear showing its size next to a human

Recreation of the Giant Short-faced bear showing its size next to a human

Many people have examined this question, and one study lays it out clearly (Christiansen 1999). Christiansen examined both the GSFB and its European cousin, the Cave Bear (Ursus spelaeus), another bear famous for its dimensions. Several skeletal measurements have been shown to correlate to overall body mass in mammals. It makes sense that large species have bones of greater relative diameter than small species, and the relationship is more or less linear. By making these measurements a very good estimate of body mass can be made for extinct mammals.

Christiansen used many skeletal measurements of modern carnivores with known body mass to create his linear equations and then plugged in both species of bears to see what the formulas suggested. The results of this study are clear—the GSFB far outweighed any of the modern bears and the cave bear.

These data suggested that a typical (average) GSFB would have weighed in at about 1,700 pounds. Given that there are exceptional individuals, it is estimated that a really large specimen could easily have weighed more than 2,200 pounds. In contrast, the cave bear seems to have a mean body mass of about 1,000 pounds, with exceptional individuals approaching the average for the GSFB.

To further help put this in context, below is a list of select modern and extinct animals and their average body masses. I threw in a couple of dinosaurs for good measure:

Animal

Body Mass (pounds)

Blue Whale

396,830

Brachiosaurus (extinct)

62,300

T. rex (extinct)

14,600

Giant Short-Faced Bear (extinct)

1,700

Kodiak Bear

1,090

North American Lion (extinct)

1,000

Cave Bear (extinct)

1,000

Polar Bear

900

African Lion

375

Indian Tiger

320

American Black Bear

230

Human

160

Leopard

115

Puma

100

Velociraptor (extinct)

98

Cheetah

86

Gray Wolf

78

Wolverine

27

Red Fox

12

No matter how you look at it, “Giant” is a good name for Arctodus!

Christiansen, P. 1999. What size were Arctodus simus and Ursus spelaeus (Carnivora: Ursidae)? Ann. Zool. Fennici 36(93-102).

Related posts:

GSFB, a Northern California Original

Denning behavior in the GSFB

Mapping the Pratt Mammoth excavation using GPS and basic surveying technology

The discovery of a partial mammoth skeleton in 1999, and its subsequent excavation in 2000, provided an opportunity to implement several innovations in the on-site mapping of the excavation and relating the excavation to real-world coordinate systems. What follows is a basic primer on what we did.

The mammoth specimen was found during the excavation of a waste-water lagoon on property owned by the City of Pratt, Kansas being leased to Pratt Feeders. While digging the lagoon the heavy equipment operator encountered a hard lens of sediment. Upon digging into it, several large bones were found. News of the discovery found its way to a reporter at the Pratt newspaper, who subsequently contacted me, then at the Sternberg Museum of Natural History. A small group from the museum traveled to Pratt for an initial investigation of the site. After an afternoon of excavating around the exposed bones it became clear that the site was more extensive and a longer excavation was needed. We planned to return to the site several weeks later.

A four-day excavation was planned with numerous volunteers and we returned to the site in November, 1999. After this exploration it again was clear that a longer period of time was needed to fully investigate the site, as we kept finding more and more fossil bone. We re-covered the site once again, and planned to return in the summer of 2000.
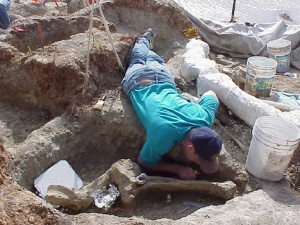
A volunteer excavates around a mammoth vertebra at the Pratt Mammoth site.

A volunteer excavates around a mammoth vertebra at the Pratt Mammoth site.

Because we had time to plan a larger excavation for the summer, and it was clear that there were many bone elements preserved, I wanted to be sure to map the site in detail, both for its paleontological resources, but also for other physical characteristics. So, I arranged to have a surveying total station on hand for the dig. We also lined up numerous volunteers, arranged a university class to be taught using the site as a learning tool, and obtained numerous donations from the generous community of Pratt. The entire community got behind the excitement of the dig, and because the site was easily accessible being at the airport, we hosted numerous visitors.

Establishment of points within the site

During the November, 1999 dig, I had established three control monuments at the site. The monuments were a hub (2 inch x 2 inch stake) and tack (a special surveying nail) driven into the ground away from the areas we were going to be disturbing in our excavations. This insured that we could re-find the control monuments and they would be used to relate all the points of the excavation to each other within the dig area.

Using the control monuments, we established an arbitrarily-oriented meter grid system. I was not concerned with the cardinal orientation of the grid so much as wanting the grid to be useful for in-site control of the dig. One of the principle uses of the grid was to demarcate 2 x 2 meter spaces to assign to volunteers to control their digging efforts. Having the grid on the ground helped to keep their efforts orderly, as they could be assigned to “dig here” and not be on top of each other. The use of the surveying total station allowed for accurate layout of the grid system across the entire site, and allowed for unlimited expansion of the system as needed.
 
The reason that the grid was redundant for the within-site location of bones is that all bones were located with the total station using standard radial surveying techniques. Every element removed from the site was given a field number, and the location of the element was documented in three-dimensions. Initially, the grid system was assigned assumed x and y coordinates in meters, and an assumed elevation was assigned to the control monuments so that the z dimension could be calculated relative to other points in the site.

The total station is set up over a point and aliened with another control point to get a starting line. The instrument can accurately measure distances by shooting a laser to a reflecting prism and measuring the time it takes to return to the instrument. It also accurately measures horizontal and vertical angles. With the vertical angle and the distance, it can calculate the difference in height (z) between the reflector and the instrument. So, with relatively simple calculations the x, y, and z coordinates of any point within the site can be determined. The instrument is highly accurate (within 1/1000’s of a meter in distance) so within-site accuracy is estimated to be high, likely within a centimeter or two given the reliability of using inexperienced volunteers to help with the surveying.
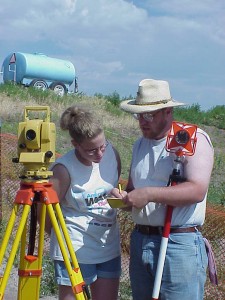
Teaching a young volunteer to use the total station surveying instrument.

Teaching a young volunteer to use the total station surveying instrument.

Most of the elements removed from the site were located with a minimum of two points. The smallest bone fragments were located with point locations of a single measurement. If they bone had any linearity to it, it was located as two points (end and end) giving both the approximate length of the bone and its linear orientation. Several of the larger bones were located with three or more points.

All of the points located at the site are described as their three dimensional coordinates, and therefore can be plotted for visualization.
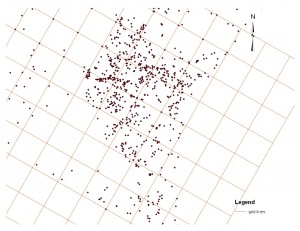
Point cloud from the Pratt Mammoth site shown in map view with the meter grid.

Point cloud from the Pratt Mammoth site shown in map view with the meter grid.

View the point cloud in a short animation.

Translation and rotation to real-world coordinate systems

During the excavation we used assumed coordinates and elevations. However, it is desirable to be able to locate the site, and all the points located within the site, in a real-world coordinate system so that it can be related to other localities anywhere in the world. We did not have high-precision global positioning system (GPS) equipment available, although such equipment does exist. However, using the following method we were able to get very effective results using a basic Garmin handheld GPS unit.

The accuracy of the handheld unit varies with availability of satellites, access to the open sky, variations in atmospheric conditions, basic limitations of the unit itself, and other variables. However, it is possible to locate a point on the globe to within approximately 15 feet or so. I used the GPS to record the location of two of my control monuments. I used the coordinates of the GPS reading to calculate the azimuth between the control monuments, and assumed that was the true azimuth. I knew the distance between the monuments based upon my field survey of measuring between them. I assumed the GPS reading on one of the control monuments to be true and “held” its coordinates to that reading. Using the azimuth to the other monument from the GPS reading, and the distance measured in the field, I then calculated the new coordinates for the second control monument.

With the assumption of the coordinates of the first monument, the accurate real-world azimuth, and the measured distance to the second control monument providing its coordinates, it was possible to recalculate the coordinates of every point within the dig site. It is a basic mathematic routine to translate (move points horizontally in space) and rotate (turn the points on an axis in space) all the points located at the dig site to a very close approximation of their real-world coordinates. Since we measured all the points in meters I used the Universe Transverse Mercator (UTM) coordinate system. I estimate that the accuracy of these coordinates should be within about 15 feet (the error of the reading on the handheld GPS). This is not as accurate as you could get with high-precision equipment, but it is accurate enough for almost all purposes, and can be achieved with inexpensive equipment that is readily available.

I have modified the system somewhat, but I have since used this basic system at other excavation sites with very good results. The real-world coordinates of every point from the site allows very accurate plotting of fossil sites, and even individual bone elements, in relation to other sites. It also allows for the application of geographic information systems (GIS) technology on the sites.
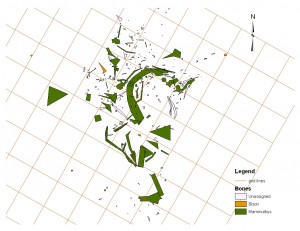
Bones drawn using the points located at the Pratt Mammoth site.

Bones drawn using the points located at the Pratt Mammoth site.
Denning behavior in the Giant Short-faced Bear

One of the most exciting things in paleontology to me is when we can begin to tease apart how extinct animals, animals that humans often never set eyes upon, lived their everyday lives. I am often amazed at how my colleagues can drill deep into questions that at first seem unanswerable; using creative ways to get answers from all the evidence that has survived, the bones, teeth, and sometimes trace fossils.

There are many examples of using the clues provided in the fossil record to come to better understand beasts from the past. In an earlier story, we looked at a disease process in Tyrannosaurus, and glimpsed how the mighty tyrant king could be brought down by a lowly protozoan. Here, we will explore some evidence for denning in the Giant Short-faced Bear (GSFB).

In a paper from several years ago Schubert and Kaufmann (2003) discussed the discovery of a GSFB in an Ozark cave. While incomplete, it is still one of the most complete specimens of the bear ever found. In addition to bones in partial articulation, they also found a thin layer of clay and minerals underneath the skeleton that preserves the remains of hair. Unfortunately, the hair is too deteriorated to tell us what color it was or exactly what its texture might have been, but its discovery is tantalizing.

This Ozark specimen is small compared to others of its species. There is a lot of evidence that there was a significant difference in size between male and female GSFBs. For example, at Rancho La Brea in southern California, both smaller and larger individuals have been found in contemporaneous deposits. It is easy to tell if the individuals are adult, so seeing large and small forms suggests two options: either there are two species, or there is one species with large and small individuals. It later is most likely. This is not surprising as all modern bears are sexually dimorphic.

Schubert and Kaufmann noted that over 1/3 of the known specimens of the GSFB come from caves, and that those specimens are smaller in general than the specimens found in open environments. (See the story about the type specimen, also found in a cave in northern California). It is logical to reason that the smaller individuals using the caves are predominately female.

Modern female bears are much more prone than males to den during periods of unfavorable conditions. And male bears are more likely to remain active throughout the year. It seems as if the GSFB followed a similar pattern—the females were using caves as denning sites, and were denning when they perished. In Cope’s original paper (1879), he called this new animal the cave bear of California—seems he was right.

From the accumulation of small bits of information we continuously piece together the lives of prehistoric beasts, slowly bringing them into sharper focus. That is the thrill of paleontology.

Cope, E. D. 1879. The cave bear of California. American Naturalist 13:791.
Schubert, B. W., and J. E. Kaufmann. 2003. A partial short-faced bear skeleton from an Ozark cave with comments on the paleobiology of the species. Journal of Cave and Karst Studies 65(2):101-110.

There are many other interesting facts here at Boneblogger. Just look around and enjoy.